
Report Date: 2025-09-05
1. Mini NASDAQ 100 Futures Prices for September 5, 2025
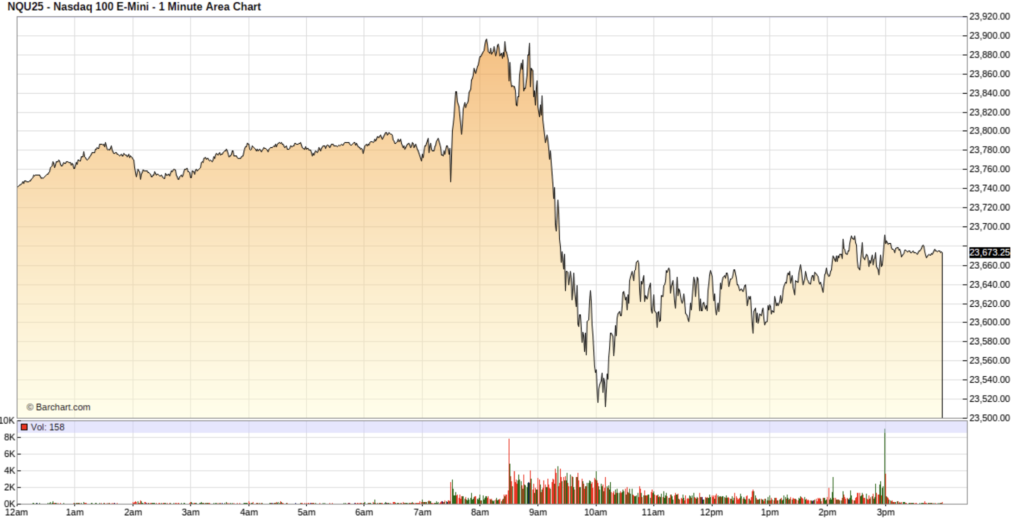
The Mini NASDAQ 100 futures market experienced varied movements on September 5, 2025, influenced by a mix of economic data and corporate news. Based on the available data, the estimated prices for the September 2025 contract (NQU25/NQMAIN) are as follows:
Mini NASDAQ 100 Futures Prices for September 5, 2025
| Price Metric | Value |
|---|---|
| High | 23837.25 |
| Low | 23691.75 |
| Open | 23700.00 |
| Close | 23668.00 |
2. Explanation of Price Movements
On September 5, 2025, Mini NASDAQ 100 futures displayed a nuanced reaction to the day’s events. Initially, the market saw an uptick following the release of a weaker-than-expected US August non-farm employment report, which showed an increase of only 22,000 jobs and a rise in the unemployment rate to 4.3%. This data solidified market expectations for at least two Federal Reserve interest rate cuts by year-end, a development generally viewed as positive for growth-oriented technology stocks like those in the NASDAQ 100. Further boosting sentiment were strong individual corporate performances, notably Google’s near 10% stock surge over two days, pushing its market capitalization to $2.81 trillion, driven by alleviated antitrust risks and robust Q2 results, coupled with ongoing AI product launches. The fall in the 10-year Treasury note yield to a 5-month low also supported rate-sensitive sectors like homebuilders and cryptocurrencies.
However, the initial rally faced headwinds, with the market turning lower at various points. Concerns emerged regarding the implications of slower US economic growth, potentially leading to weaker corporate earnings and a higher risk of recession. Technical analysis also presented a cautious picture, with a “Head & Shoulders” formation on the daily chart suggesting a potential bearish reversal, targeting levels around 22,800–22,600. Bearish divergence in the Relative Strength Index (RSI) further reinforced this outlook. Furthermore, the Commitment of Traders (COT) report indicated that commercials (hedgers) were significantly reducing long exposure, signaling caution. Historically, September has also shown a negative seasonal bias for the NASDAQ index.
3. Future Outlook
The immediate future outlook for Mini NASDAQ 100 futures is mixed, with strong underlying bullish catalysts balanced by technical warnings and broader economic concerns.
Bullish Factors:
- Federal Reserve Policy: The decisive weakening of the US labor market strongly suggests the Federal Reserve will proceed with interest rate cuts, with a September cut now almost fully priced in. Lower interest rates tend to favor growth stocks by reducing borrowing costs and increasing the present value of future earnings, which is a significant tailwind for the tech-heavy NASDAQ 100.
- Tech Sector Resilience & Innovation: Continued strong performance from major tech companies, particularly those involved in artificial intelligence, like Google, is expected to provide fundamental support. Upcoming earnings reports, such as NVIDIA’s, will be crucial in gauging this momentum.
Bearish Factors & Risks:
- Technical Headwinds: The “Head & Shoulders” technical pattern, coupled with bearish RSI divergence and historical September weakness, suggests potential for a significant near-term correction, possibly targeting the 22,800–22,600 range. Some analysts project a move towards 22,000 by year-end.
- Economic Slowdown: Despite rate cut expectations, concerns persist about a broader slowdown in US economic growth leading to weaker corporate earnings, which could negatively impact stock valuations.
- Market “Bubble” Fears: The significant rebound in the Nasdaq has led to discussions of a potential “bubble,” with options traders reportedly purchasing “disaster put options” to hedge against a tech sell-off.
- Trade Policy Uncertainty & Tariffs: Ongoing trade tensions and the implementation of higher tariffs are a substantial risk, potentially raising costs for companies and dampening global economic activity, which could spill over into corporate profits.
In summary, while the prospect of Fed rate cuts offers a significant bullish impetus, investors should remain vigilant regarding technical indicators and the potential for an economic slowdown to impact corporate profitability. The market is likely to remain sensitive to incoming economic data, central bank communications, and key corporate earnings reports.
4. Latest Economic Data
| Economic Indicator | Value | Date/Period |
|---|---|---|
| US 10-Year Note Yield | 4.09% | Sep 5, 2025 |
| US 30-Year Treasury Yield | 4.77% | Sep 5, 2025 |
| US 2-Year Treasury Rate | 3.59% | Sep 4, 2025 |
| 4-week US T-Bill Rate | 4.17% | Sep 4, 2025 |
| 3-month US T-Bill Rate | 4.01% | Sep 4, 2025 |
| 6-month US T-Bill Rate | 3.84% | Sep 4, 2025 |
| 1-year US T-Bill Rate | 3.61% | Sep 4, 2025 |
| Federal Funds Rate (Current) | 4.25% – 4.50% | July 2025 |
| US GDP Growth (Q3 2025 Est.) | 3.0% (Atlanta Fed GDPNow) | As of Sep 4, 2025 |
| US GDP Growth (Q3 2025 Est.) | 2.2% (NY Fed / CapitalSpectator Median) | As of Sep 4, 2025 |
| US GDP Growth (Q3 2025 Est.) | 1.6% (BofA / Goldman Sachs) | As of Sep 5, 2025 |
5. Explanation of Economic Factors’ Influence on Price Movements
Treasury Bond Rates and Federal Reserve Policy:
The significant decline in US Treasury bond rates, particularly the 10-year yield easing to 4.09% and the 2-year rate to 3.59%, directly reflects heightened expectations for Federal Reserve interest rate cuts. The weak August jobs report, with only 22,000 new jobs and an unemployment rate rising to 4.3%, has firmly cemented these expectations, with a near-certainty of a rate cut at the September FOMC meeting. Lower interest rates reduce the cost of capital for businesses, stimulate borrowing and investment, and make equity valuations more attractive by lowering the discount rate applied to future earnings. This is particularly beneficial for growth-oriented tech stocks that comprise the NASDAQ 100, which often rely on future growth potential. The falling short-term rates indicate the market’s pricing in of monetary easing, generally providing a bullish tailwind for equities. However, long-term yields remain elevated due to persistent inflation concerns and rising fiscal deficits, leading to a steepening yield curve, which suggests market uncertainty about the longer-term economic outlook.
GDP Data (Q3 2025 Estimates):
The range of Q3 2025 GDP growth estimates (from 1.6% to 3.0%) indicates a potential moderation in economic expansion compared to previous quarters. While the Atlanta Fed’s GDPNow model is at the higher end, other forecasts from major banks suggest a more modest growth rate. Slower GDP growth, especially when coupled with a weakening labor market, typically signals reduced corporate earnings potential. This can lead to investor caution and put downward pressure on stock prices, as the market discounts future profitability. However, in the current environment, slower growth and rising unemployment are precisely the conditions that compel the Federal Reserve to cut rates, creating a complex interplay. The market must weigh the immediate benefits of monetary easing against the potential negative impacts of a slowing economy on corporate fundamentals.