August 1, 2025
Estimated Mini NASDAQ 100 Futures Prices
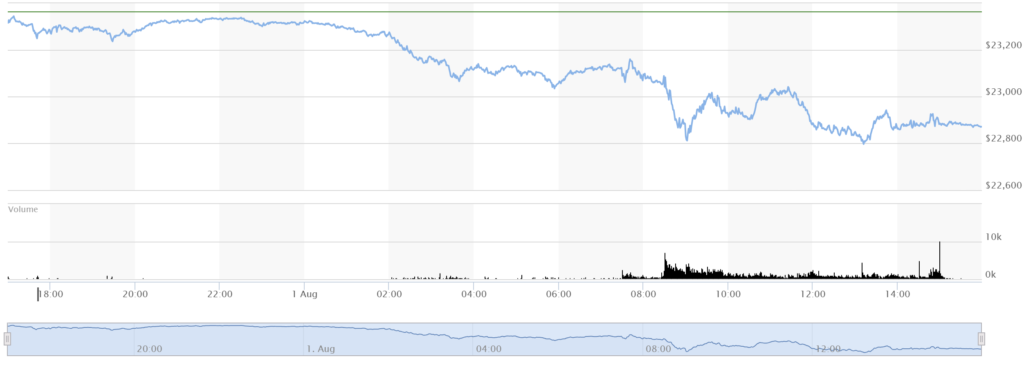
Estimated High: 23,347.50
Estimated Low: 22,788.25
Estimated Open: 23,021.66 (based on pre-market indicator)
Estimated Close: 22,883.75
Explanation of Potential Price Movements
Mini NASDAQ 100 futures experienced significant downward pressure on August 1, 2025, driven by a confluence of negative economic news and market sentiment. The primary factors contributing to this decline were:
- New Tariffs and Trade War Fears: President Trump’s executive order imposing new tariffs (10% to 41%) on imports from 92 countries, particularly a significant hike on Canadian goods, ignited fears of a global trade war and supply chain disruptions. This “risk-off” sentiment weighed heavily on the tech-heavy Nasdaq 100, as its constituent companies often have global supply chains and international market exposure. The tariffs are expected to raise input costs and consumer prices, complicating the economic outlook.
- Weak U.S. Jobs Report: The U.S. Labor Department’s report for July showed a weaker-than-expected addition of only 73,000 jobs, falling short of the 100,000 anticipation, with significant downward revisions for May and June. This data fueled recession fears, leading to an immediate negative reaction in equity markets and increased expectations for the Federal Reserve to cut interest rates sooner.
- Federal Reserve Stance and Rate Cut Expectations: While the Fed had kept interest rates steady earlier in the week, the deteriorating labor market data intensified market pressure for rate cuts. Traders are now pricing in an approximately 80% likelihood of a 25 basis point cut at the September FOMC meeting, with further cuts anticipated later in the year. The initial market reaction to the weak jobs report and the potential for a more aggressive easing cycle was negative, as it signaled underlying economic weakness.
- Mixed Corporate Earnings: Despite strong earnings from some tech giants like Meta Platforms, Microsoft, and Apple, overall corporate sentiment was dampened by disappointing profit outlooks from other significant companies like Amazon, Caterpillar, and Nike. This mixed bag of earnings, combined with broader macroeconomic concerns, contributed to the sell-off.
Collectively, these factors led to Nasdaq 100 futures slipping by 0.5% in pre-market trading and dropping by 1.3% by market open, culminating in a 2.06% decline for the continuous contract by the end of the day. The Nasdaq Composite had its worst weekly performance since mid-May, and the CBOE Volatility Index (VIX) surged, reflecting increased market apprehension.
Reasoned Future Outlook
The immediate outlook for Mini NASDAQ 100 futures appears cautious to bearish in the near term. Technical indicators, such as the Relative Strength Index (RSI) breaking below the midline and a strong bearish weekly candle, suggest a loss of momentum and potential for further correction. Traders are looking at key Fibonacci retracement levels around 22,120 and 21,045 as potential support. The market’s significant net long positioning, with commercials increasing their hedging shorts, signals a heightened risk of a deeper correction as excessive bullish sentiment unwinds.
However, several counterbalancing factors could influence the medium-to-long-term outlook:
- Federal Reserve Policy: The increasing likelihood of Federal Reserve interest rate cuts due to the weakening labor market could eventually provide support for equities, as lower rates reduce borrowing costs and make equity valuations more attractive, particularly for growth-oriented tech companies.
- Economic Growth: While 2025 GDP forecasts suggest a slowdown (around 1.4-1.6%), the strong Q2 2025 rebound (3.0% annual rate) indicates underlying resilience. The long-term impact of new tariffs on GDP remains a key uncertainty.
- Tech Sector Fundamentals: Despite recent market rotation, the underlying strength of major technology firms, particularly those benefiting from advancements in artificial intelligence (AI), continues to be a significant driving force for the Nasdaq 100.
- Seasonality: Historically, August has been a strong month for the NASDAQ. However, this often precedes more pronounced corrections in September, advising caution.
Overall, continued volatility is anticipated as the market navigates the complex interplay of trade policy, labor market dynamics, inflation concerns, and monetary policy decisions. The immediate focus will be on further economic data releases and corporate guidance, with a potential for a short-term bearish trend tempered by the prospect of future Fed easing and the foundational strength of the tech sector.
Latest Economic Data (Around August 1, 2025)
| Economic Indicator | Value | Notes |
|---|---|---|
| US Treasury Bond Rates | ||
| 10-Year Treasury Note Yield | 4.23% | Fell 0.15 percentage points from previous session |
| 2-Year Treasury Note Yield | 3.69% | Lowest level in three months |
| 3-Month Treasury Yield | 4.35% | |
| 30-Year Treasury Yield | 4.81% | |
| US Gross Domestic Product (GDP) | ||
| Q2 2025 Real GDP Growth (Advance) | +3.0% (annual rate) | Rebound from Q1; higher than 2.5% forecast |
| Q1 2025 Real GDP Growth | -0.5% | |
| Q3 2025 GDPNow Estimate (Aug 1) | +2.1% | Slight decrease from July 31st estimate |
| 2025 Real GDP Growth Forecast | +1.4% to +1.6% | Consensus, Federal Reserve, OECD, Deloitte forecasts |
Explanation of How These Economic Factors Influence Price Movements
- US Treasury Bond Rates: Generally, falling Treasury bond yields (as seen on August 1st with the 10-year and 2-year yields dropping) can be positive for growth stocks, particularly in the technology sector that dominates the Nasdaq 100. Lower yields reduce the discount rate used in valuation models, making future earnings streams more valuable. They also signal lower borrowing costs for companies. However, in this instance, the drop in yields was primarily driven by the weak jobs report and increased recession fears, which initially led to a negative market reaction. Investors flocked to the safety of government bonds, pushing yields down. This indicates that the decline in yields was a symptom of economic concern rather than a purely bullish signal for equities.
- US Gross Domestic Product (GDP) Data: A strong GDP print, like the 3.0% increase in Q2 2025, typically signals a healthy economy, which is generally bullish for corporate earnings and stock market performance. It shows a significant rebound from the Q1 contraction and suggests underlying economic resilience. However, the forward-looking forecasts for 2025 indicating slower growth (around 1.4-1.6%) temper this optimism. Furthermore, the newly imposed tariffs are projected to negatively impact future GDP growth and increase consumer prices, introducing an element of economic uncertainty that can override the positive impact of a strong prior quarter. The mixed signals from GDP (strong Q2 rebound vs. lower 2025 forecasts and tariff impact) contribute to market volatility, where a positive past performance is overshadowed by concerns for future economic slowdowns and inflationary pressures.