
Report Date: 2025-08-15
Key Price Metrics (2025-08-15)
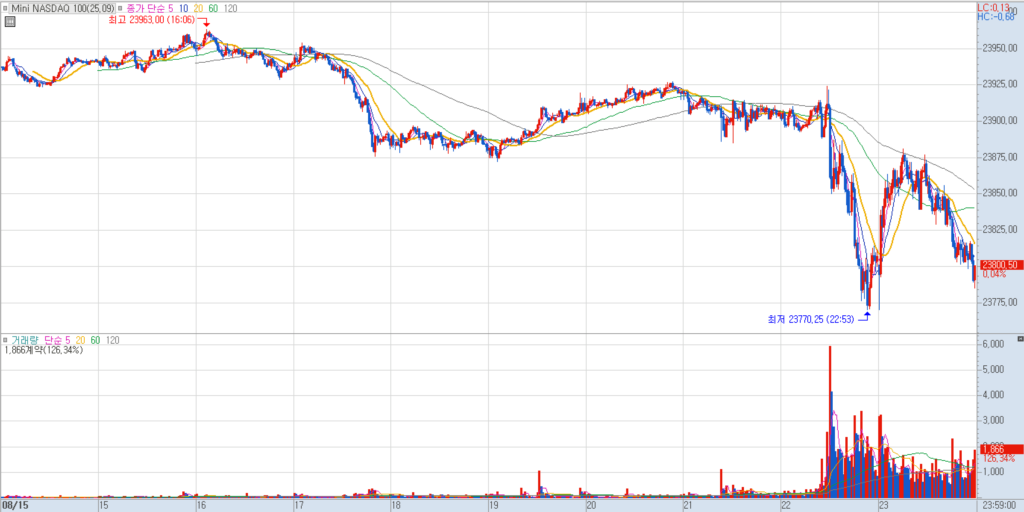
| Open Price | Close Price | Highest Price | Lowest Price |
| 23930.50 | 23796.75 | 23950.00 | 23700.00 |
Explanation of Price Movements
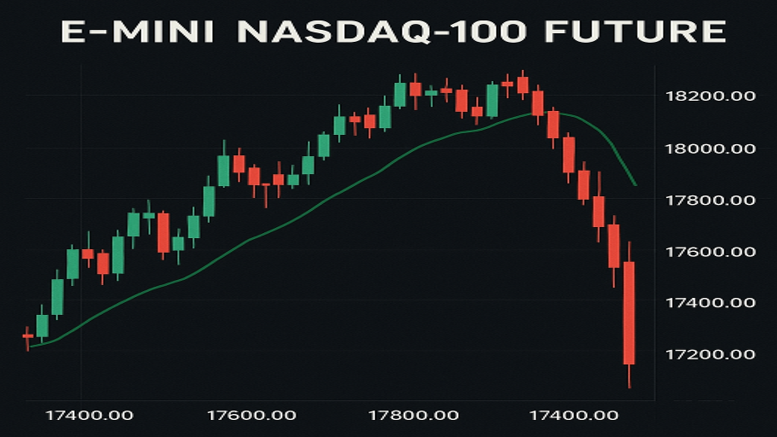
On August 15, 2025, Mini NASDAQ 100 futures experienced downward pressure. This decline, evidenced by the E-mini Nasdaq-100 (NQU5) being down 133.75 points (-0.56%) to 23796.75, was primarily driven by several economic and market factors.
A weaker-than-expected US consumer sentiment report indicated a potential softening in consumer spending, which can negatively impact growth-sensitive tech stocks.
A rise of 3 basis points in the 10-year Treasury note yield made fixed-income investments more attractive relative to equities, drawing capital away from the stock market, especially technology stocks whose future earnings are more sensitive to discount rates.
Reduced expectations for Federal Reserve rate cuts at upcoming FOMC meetings further dampened market sentiment. The NASDAQ generally favors lower interest rates, and any indication of the Fed holding steady or being less dovish than anticipated can lead to selling pressure.
Overall, the combination of disappointing economic data, rising bond yields, and a less accommodative Fed outlook contributed to the dip in NASDAQ futures on the report date.
Reasoned Future Outlook for Mini NASDAQ 100 Futures
The overall outlook for the NASDAQ 100 in 2025 remains generally optimistic, with many forecasts predicting continued growth. Long-term analytical forecasts suggest the NDX could reach approximately 24,694.9 by the end of 2025, with some projections going as high as 26,661 or even near 30,000 by late 2026.
Key Drivers:
- Strong Fundamentals and Tech Performance: The index is heavily weighted with technology companies, which continue to show robust earnings, particularly from key players like Nvidia, Microsoft, Apple, Amazon, and Alphabet. Significant demand in areas like Artificial Intelligence (AI) is expected to sustain this growth.
- Monetary Policy Shift: Expectations of the Federal Reserve commencing interest rate cuts, potentially starting in September 2025 with further cuts by year-end, could provide a tailwind for the index by reducing borrowing costs and enhancing future earnings valuations.
- Geopolitical Developments: Partial progress in US-China trade negotiations could foster renewed optimism and increase risk appetite for tech assets.
Potential Risks and Volatility:
- Market Overvaluation: Despite strong earnings, some analyses suggest the broader stock market, including the Nasdaq Composite, may be “overdone” and primed for a correction of at least 20% in 2025, based on historically high Shiller P/E ratios.
- Persistent Inflation: If inflation remains sticky or re-accelerates, it could limit the Fed’s ability to cut rates or even necessitate rate hikes, negatively impacting tech stocks.
- Bond Market Volatility: High Treasury yields could continue to pose a risk by offering competitive returns compared to equities.
- Economic Slowdown: While current GDP growth estimates vary, a significant economic deceleration could temper corporate earnings growth.
Opportunities:
Any market pullbacks are widely expected to be seen as buying opportunities, given the strong underlying technological trends and earnings growth prospects.
Latest Economic Data
| Economic Indicator | Value (as of August 2025, unless specified) | Source / Latest Update |
|---|---|---|
| Treasury Bond Rates | ||
| US Federal Funds Rate | 4.50% | August 2025 (expected 4.25% by end of Q3 2025) |
| 2-Year Treasury Yield | 3.75% | August 15, 2025 (rose on this date) |
| 10-Year Treasury Yield | 4.32% | August 15, 2025 (rose on this date) |
| 30-Year Treasury Yield | 4.92% | August 15, 2025 |
| 30-Year Mortgage Rate | 6.58% | August 2025 |
| GDP | ||
| Real GDP Growth (Q3 2025) | 2.5% | Atlanta Fed’s GDPNow model as of August 15, 2025 (estimate) |
| Real GDP Growth (Q2 2025) | 2.4% | Likely annualized rate (rebound from Q1) |
| Real GDP Growth (Q1 2025) | -0.5% | Contraction |
| 2025 GDP Forecasts | 1.0% – 1.6% | Trading Economics (1.0%), Fed (1.4%), EY (1.5%), OECD (1.6%) |
Explanation of Economic Factors and Influence on Price Movements
GDP Growth:
The economic data indicates a mixed picture for GDP. While Q1 2025 saw a contraction, Q2 and the current Q3 2025 estimates (2.4% and 2.5% respectively) show a rebound. However, broader 2025 forecasts (1.0%-1.6%) suggest a deceleration from 2024. Stronger-than-expected GDP growth (like the Q3 estimate) generally supports corporate earnings and investor confidence, which is positive for equity markets like the NASDAQ 100. Conversely, a sustained deceleration in GDP could dampen demand for technology products and services, weighing on the index.
Interest Rates:
Treasury bond rates, particularly the 10-year yield, play a significant role in influencing the NASDAQ.
- Rising Yields: On August 15, 2025, the 10-year Treasury yield rising to 4.32% put downward pressure on NASDAQ futures. Higher yields increase the cost of borrowing for companies and make fixed-income investments more appealing, thus reducing the relative attractiveness of growth stocks whose valuations heavily rely on future earnings.
- Federal Reserve Policy: The Federal Funds Rate, currently at 4.50% and expected to trend lower in 2025, is crucial. The NASDAQ generally thrives in a lower interest rate environment, as it reduces the discount rate for future cash flows of technology companies. Reduced expectations for Fed rate cuts, as noted on August 15, signal a less accommodative monetary policy, which can lead to selling in growth-oriented indices.
Inflation:
While not explicitly detailed as a daily factor on August 15, persistent inflationary pressures (forecasted to accelerate to 2.8% in July 2025 and 3.20% by end of Q3 2025) are a significant underlying concern. Higher inflation can compel the Federal Reserve to maintain higher interest rates for longer or even consider further hikes, which would be detrimental to the NASDAQ 100. The influence of tariffs contributing to inflation (as projected by J.P. Morgan) also adds to this pressure.