The Specter of Stagflation
A Risk Analysis for the Modern U.S. Economy
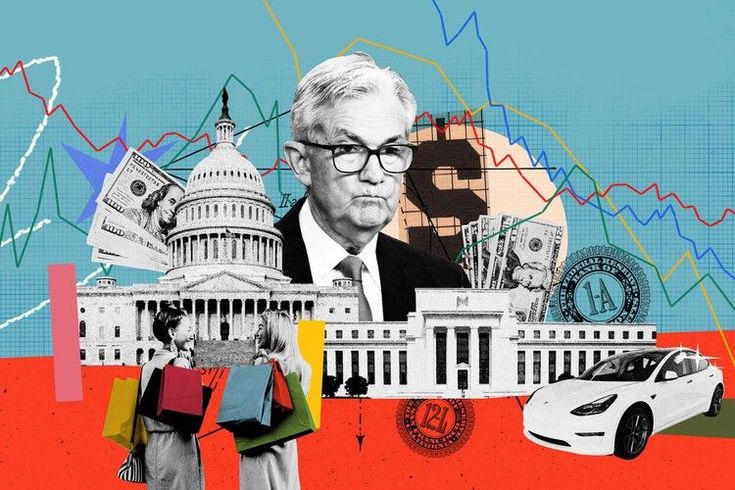
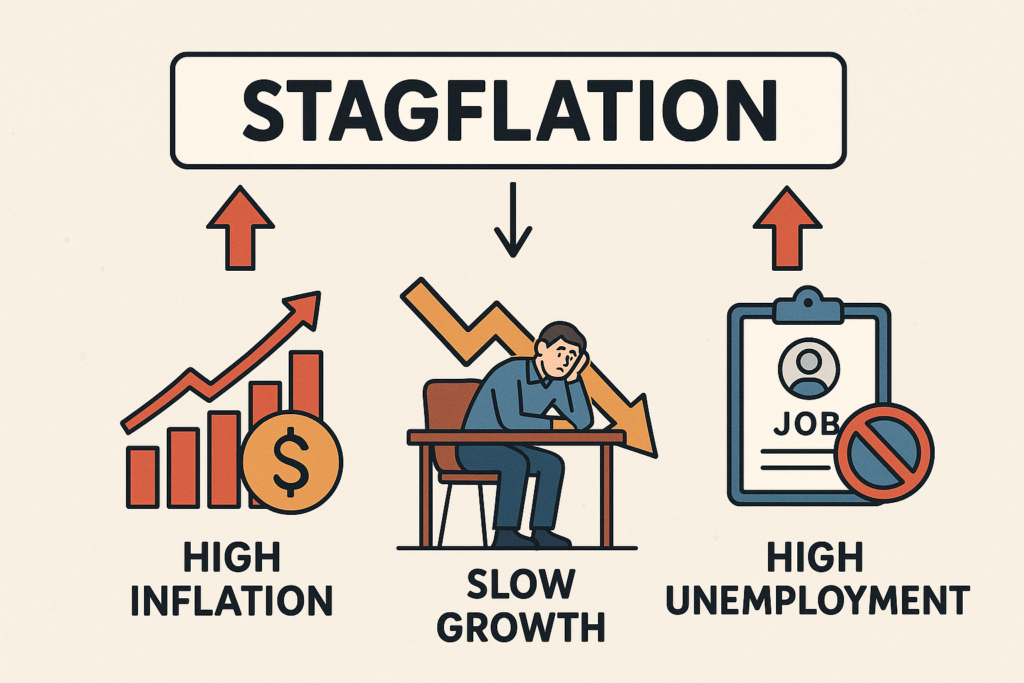
Understanding the Economic Anomaly
📉
Stagnant Growth
Economic output slows down or declines, leading to job losses and reduced business investment.
💹
High Inflation
The general level of prices for goods and services rises, eroding purchasing power.
👪
High Unemployment
A significant portion of the labor force is jobless and actively seeking employment.
Stagflation is a toxic combination of these three conditions. It defies classic economic theory, like the Phillips Curve, which posits an inverse relationship between inflation and unemployment, making it particularly challenging for policymakers to address.
A Look Back: The Great Inflation of the 1970s
The most prominent case of stagflation in the U.S. occurred in the 1970s. A combination of factors, including oil price shocks from the OPEC embargo, expansionary monetary policy, and wage-price spirals, created a prolonged period of economic misery. This chart illustrates the simultaneous rise in both inflation and unemployment, the defining feature of that era.
U.S. Economic Dashboard: Current Key Indicators
(August 2025)
(Q2 2025)
(August 2025)
Interactive Risk Scenario Modeler
Adjust the sliders to model a future economic scenario and receive an AI-powered risk assessment.
Modern Pressures: Analyzing Today’s Risk Factors
Inflation vs. GDP Growth Trends
This chart tracks the recent divergence between inflation and economic growth. While inflation has remained persistently above the Federal Reserve’s 2% target, GDP growth has been sluggish. This widening gap is a primary concern and a leading indicator for stagflationary risk.
Unemployment Rate Analysis
The U.S. labor market has shown resilience, with the unemployment rate remaining relatively low. This is a key factor mitigating the risk of full-blown stagflation. However, a gradual uptick in unemployment alongside persistent inflation could signal a shift towards a more dangerous economic environment.
How Stagflationary Pressures Emerge
1. Negative Supply Shock
An unexpected event, such as a geopolitical conflict or a pandemic, disrupts supply chains, increasing the cost of production for raw materials and goods (e.g., oil, microchips).
2. Cost-Push Inflation
Businesses pass on their higher production costs to consumers in the form of higher prices. This leads to a rise in the overall price level (inflation).
3. Reduced Output & Demand
Higher prices reduce the real income of consumers, causing them to cut back on spending. This decrease in demand leads to lower production and slower economic growth.
4. Rising Unemployment
As businesses face lower demand and higher costs, they may reduce investment and lay off workers, causing the unemployment rate to rise.
Risk Assessment & Forward Outlook
Comparing Key Economic Drivers
This radar chart provides a comparative snapshot of the current economic environment versus the 1970s stagflationary period. While inflation and supply chain issues show some concerning parallels, today’s economy benefits from a stronger labor market, more independent monetary policy, and less energy dependence. These factors currently temper the overall risk.
- Inflation Expectations: Currently more anchored than in the 1970s, reducing the risk of a wage-price spiral.
- Labor Market: Remains relatively tight, providing a buffer against mass unemployment.
- Energy Dependence: The U.S. is less reliant on foreign oil imports compared to the 1970s.
Conclusion: Elevated Risk, but Not a Repeat of the 1970s
The current probability of sustained, classic stagflation in the U.S. is moderate but elevated. While the economy faces significant headwinds from supply-side issues and persistent inflation, the underlying strength of the labor market and more credible central bank policy make a full-blown 1970s-style crisis less likely. The key risk going forward is a policy misstep by the Federal Reserve—either tightening too aggressively and causing a deep recession, or not tightening enough and allowing inflation expectations to become unanchored.