Stagflation Analysis
An Interactive Economic Dashboard
Q3 2025
Economic Snapshot
This section provides a high-level overview of the key indicators defining the current stagflationary risk environment. These metrics form the basis of our deeper analysis.
Inflation (Core PCE, YoY)
3.5%
▲ Trending Above Target
Real GDP Growth (Annualized)
1.0%
▬ Stagnant / Below Trend
Unemployment Rate
4.3%
▲ Slowly Ticking Upward
Causal Analysis: Past and Present
Understanding the threat of stagflation requires looking at both historical precedents and current, unique economic pressures. This section allows you to explore the factors contributing to the current risk.
Historical Parallel: The 1970s vs. Today
Toggle between metrics to compare the trends of the 1970s stagflationary period with the current environment. This helps contextualize the severity of today’s situation.
Modern Risk Factors
Click on each factor to see a detailed explanation of its contribution to the risk of stagflation. This interactive diagram shows how different pressures combine.
Supply Chain Disruptions & Geopolitics
Aggressive Monetary Policy
Slowing Consumer Demand
Click a factor above for details.
Scenario Modeler
The path forward is not set. This modeler allows you to explore three potential economic scenarios for the next 12-18 months and see their projected impact on key asset classes.
Projected Asset Performance: Stable Growth
Scenario Analysis
Stable Growth (Soft Landing)
In this optimistic scenario, inflation gradually returns to the Fed’s 2% target without a significant economic downturn. Growth remains resilient, and unemployment stays low. U.S. equities perform well, driven by steady earnings, while bonds provide modest returns. Commodities see less upward pressure.
Policy Simulator
Stagflation presents a profound dilemma for policymakers. Use the sliders below to simulate different policy responses and observe the difficult trade-offs between controlling inflation and supporting growth.
Policy Levers
Projected Outcomes
Projected Inflation
3.5%
Projected GDP Growth
1.0%
Stagflation Risk Calculator
Adjust the sliders for the three main economic indicators to calculate a theoretical stagflation likelihood score. This tool helps illustrate how changes in these metrics contribute to the overall risk.
Economic Inputs
Calculated Risk Likelihood
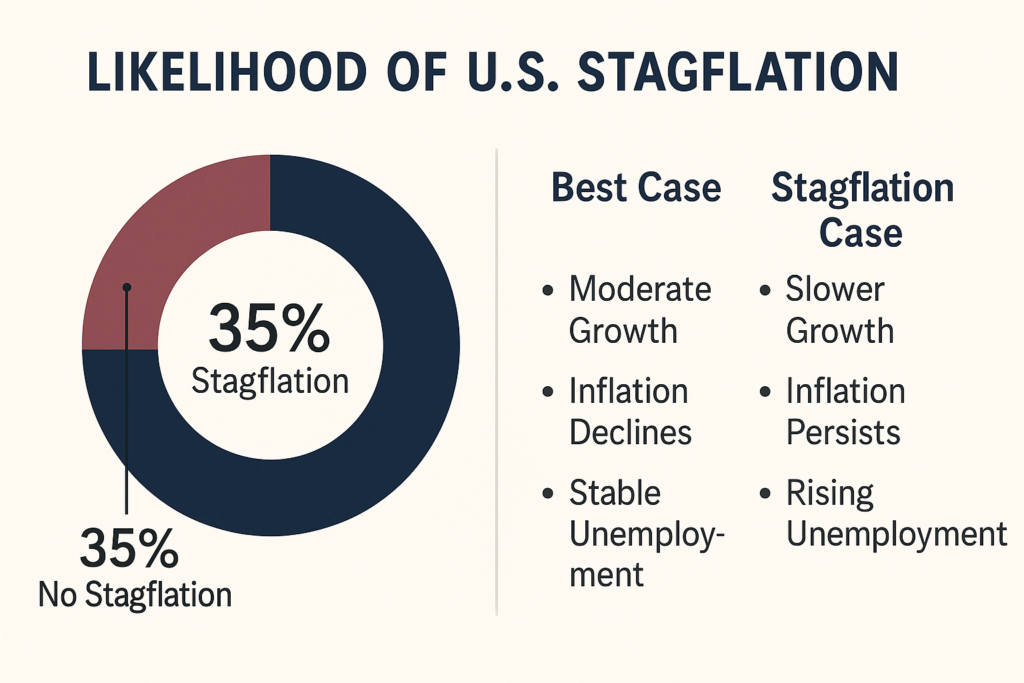
Moderate Risk
The combination of above-target inflation, slow growth, and rising unemployment points to a significant risk of stagflation.